Purpose
The purpose of this Report Description provides a list of active employees within the organizational unit selected, along with each employee’s performance rating and salary as of the end of the year cycle selected.
Report Description
The B0040: Employee Performance Rating & Salary report provides a list of active employees within the organizational unit selected, along with each employee’s performance rating and salary as of the end of the year cycle selected.
Report Location
PA: Performance Ratings
Report Uses
- This report can be used to obtain the list of performance ratings for the organizational unit specified to view the ratings have been entered for the employees within the organizational unit specified.
- This report can be used to determine if a supervisor has completed the ratings for the employees within his/her unit, or if there are missing entries for specific employees.
How to Generate This Report
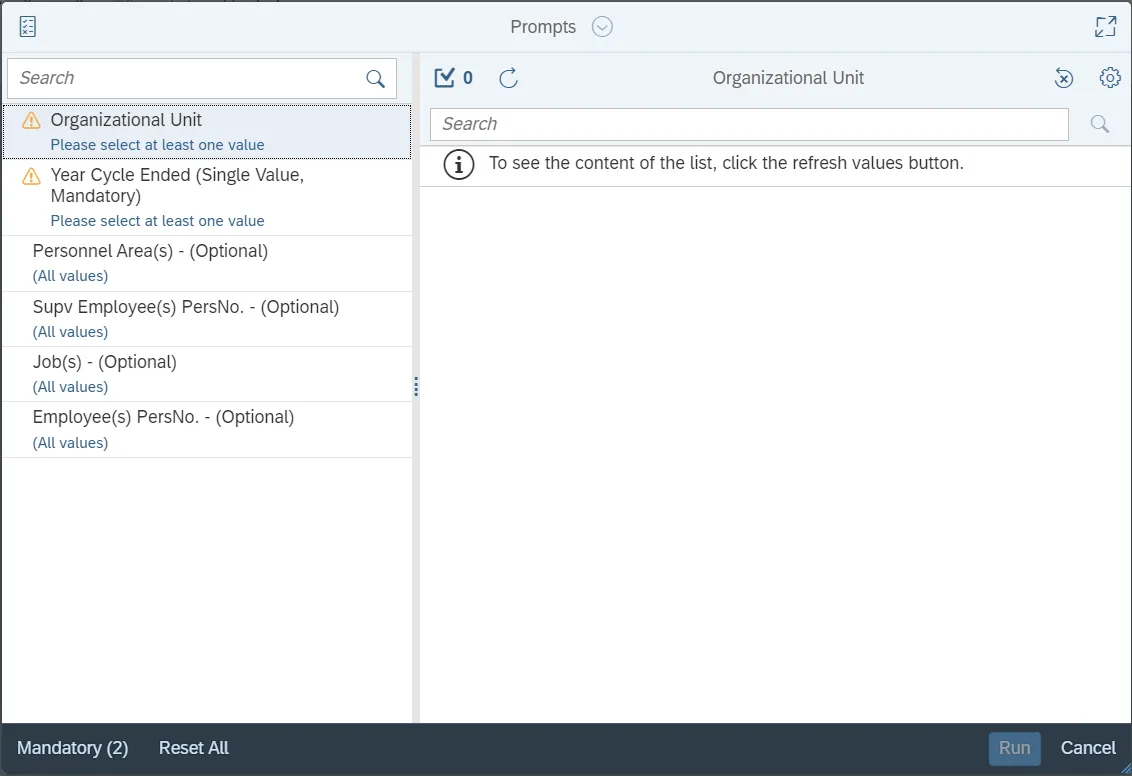
This report is generated after selecting values for the mandatory prompts. All mandatory prompts must have values selected before the Run Icon can be used to generate the report. Mandatory prompts can be identified as mandatory by the exclamation mark inside of the yellow-orange triangle, the square with the checkmark, or the display of (Mandatory). Detailed instructions for interaction with each prompt can be found on the Web Intelligence Prompt List on the OSC website.
The Mandatory prompts for this report are:
- Organizational Unit
- Year Cycle Ended (Single Value, Mandatory)
This report can also be further limited by utilizing the Optional prompts to further limiting the amount of data that retrieved into the body of the report. Optional prompts are indicated as optional in parentheses beside the prompt.
The Optional prompts are:
- Personnel Area(s) - (Optional)
- Supv Employee(s) PersNo. - (Optional)
- Job(s) - (Optional)
- Employee(s) PersNo. - (Optional)
Initial Layout
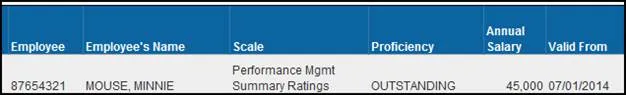
The report is generated with a list of active employees who have a performance rating in the system for the organizational unit and fiscal year end selected. Below is a sample of the report:
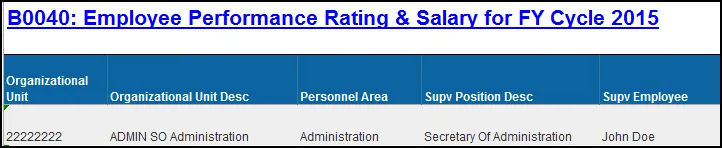
Continued...
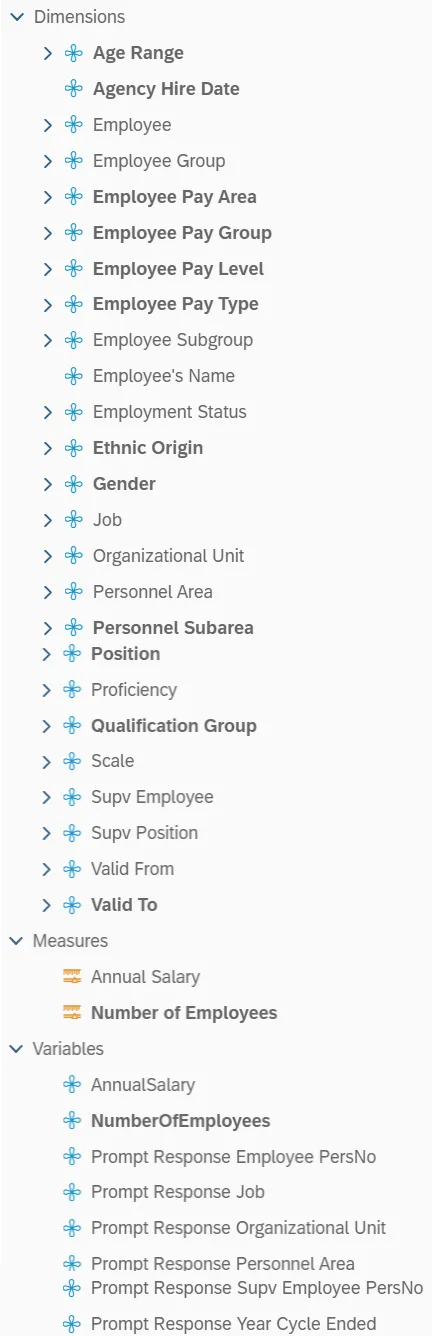
Available Objects
This is a list of the available objects that can be added to the report, once in Design mode:
Dimensions
- Age Range
- Agency Hire Date
- Employee
- Employee Group
- Employee Pay Area
- Employee Pay Group
- Employee Pay Level
- Employee Pay Type
- Employee Subgroup
- Employee's Name
- Employment Status
- Ethnic Origin
- Gender
- Job
- Organizational Unit
- Personnel Area
- Personnel Subarea
- Position
- Proficiency
- Qualification Group
- Scale
- Supv Employee
- Supv Position
- Valid From
- Valid To
Measures
- Annual Salary
- Number of Employees
Variables
- Annual Salary
- Number Of Employees
- Prompt Response Employee PersNo
- Prompt Response Job
- Prompt Response Organizational Unit
- Prompt Response Personnel Area
- Prompt Response Supv Employee PersNo
- Prompt Response Year Cycle Ended
Special Report Considerations/Features
- The report defaults to generating list of all active employees who have a performance rating entered for the year selected.
- The data is refreshed daily, and is current as of the close of business from the previous business day.
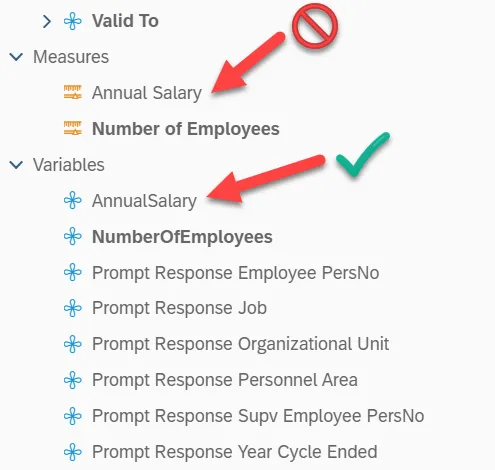
- The annual salary on the base report is a variable named “AnnualSalary”. If you remove this variable from the report, and later decide that you need it, you will need to add the variable named “AnnualSalary” (shown with the check mark below). Do not use the measure named “Annual Salary”. If so, the report will return values of #UNAVAILABLE in that column due to filtering.
- This report contains filters that exclude specific jobs, employee groups and employee subgroups.
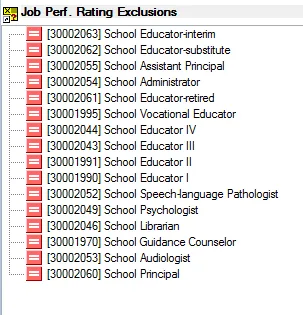
- The following educational jobs are excluded from the report with a report filter:
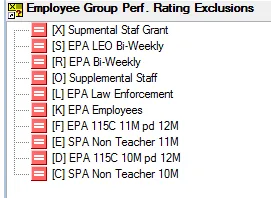
- The following Employee Groups are excluded from the report with a report filter:
- The following Temporary Employee Subgroups are excluded from the report with a report filter:
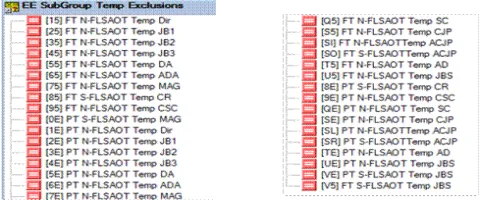
- These filters can be edited if you need to include any of these values on the report:
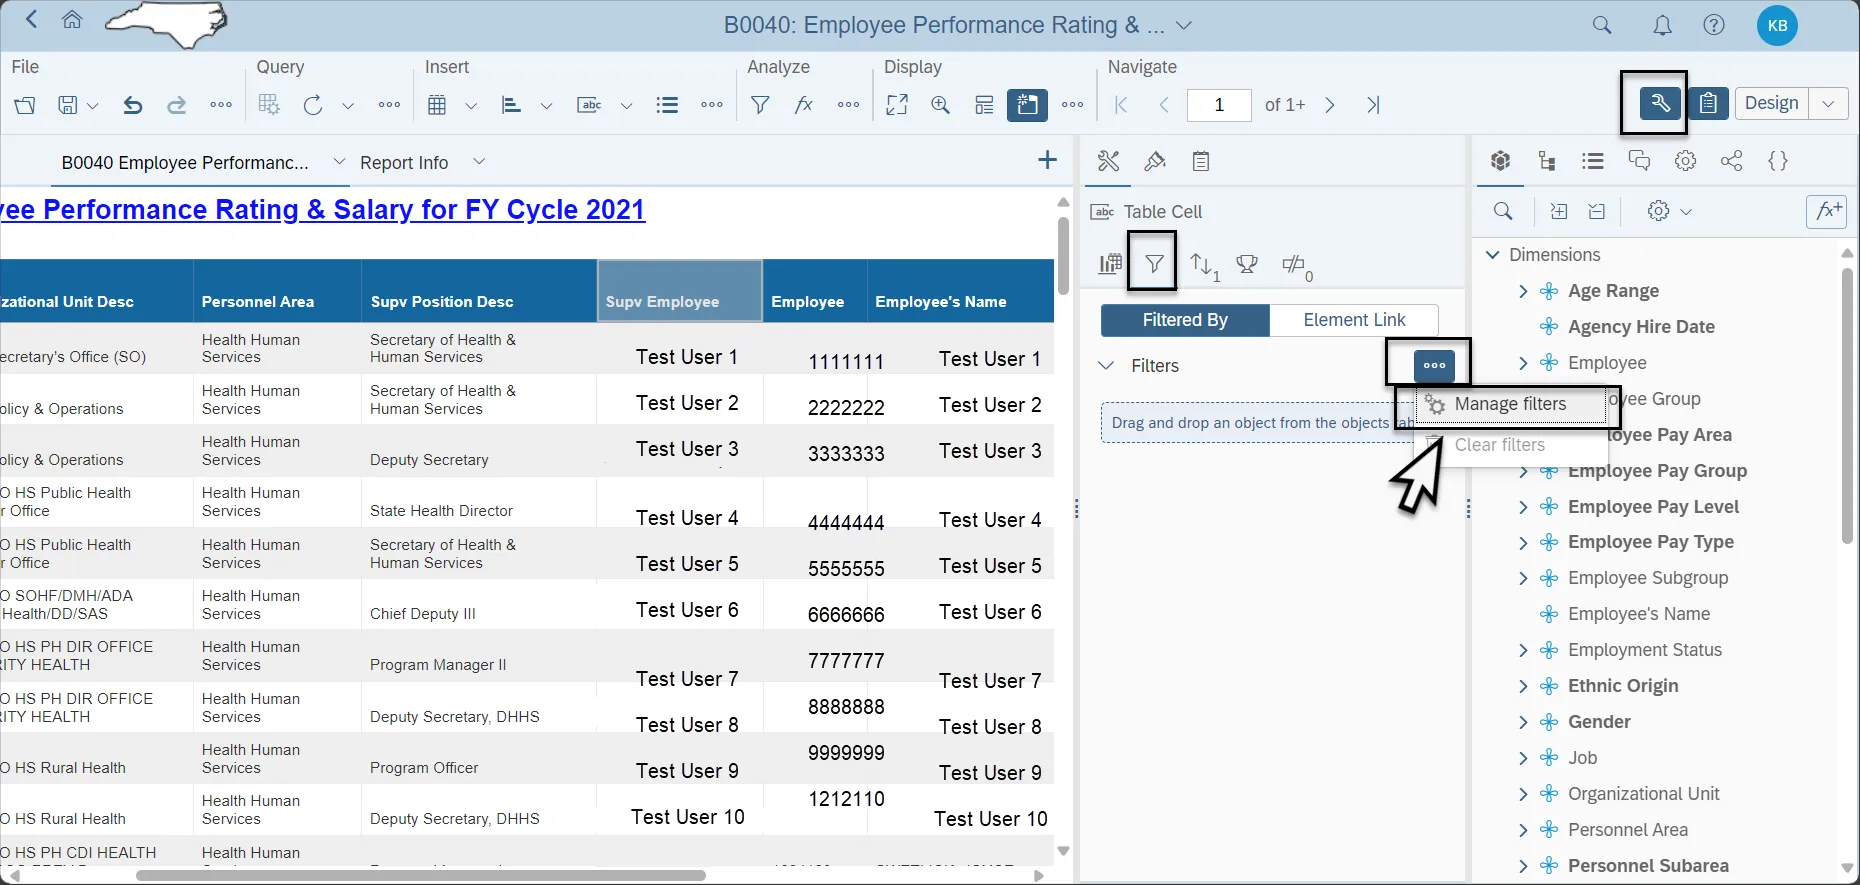
Step 1 - Once in the report, click on the “Design” menu option to go into design mode
Step 2 - Click on the “Show Data/format panel icon
Step 3 - Click on the filter tab and then click on the ellipses next to Filters
Step 4 - Select “Manage Filter”
Step 5 - Select the Report name on left panel to display the filters for this report.
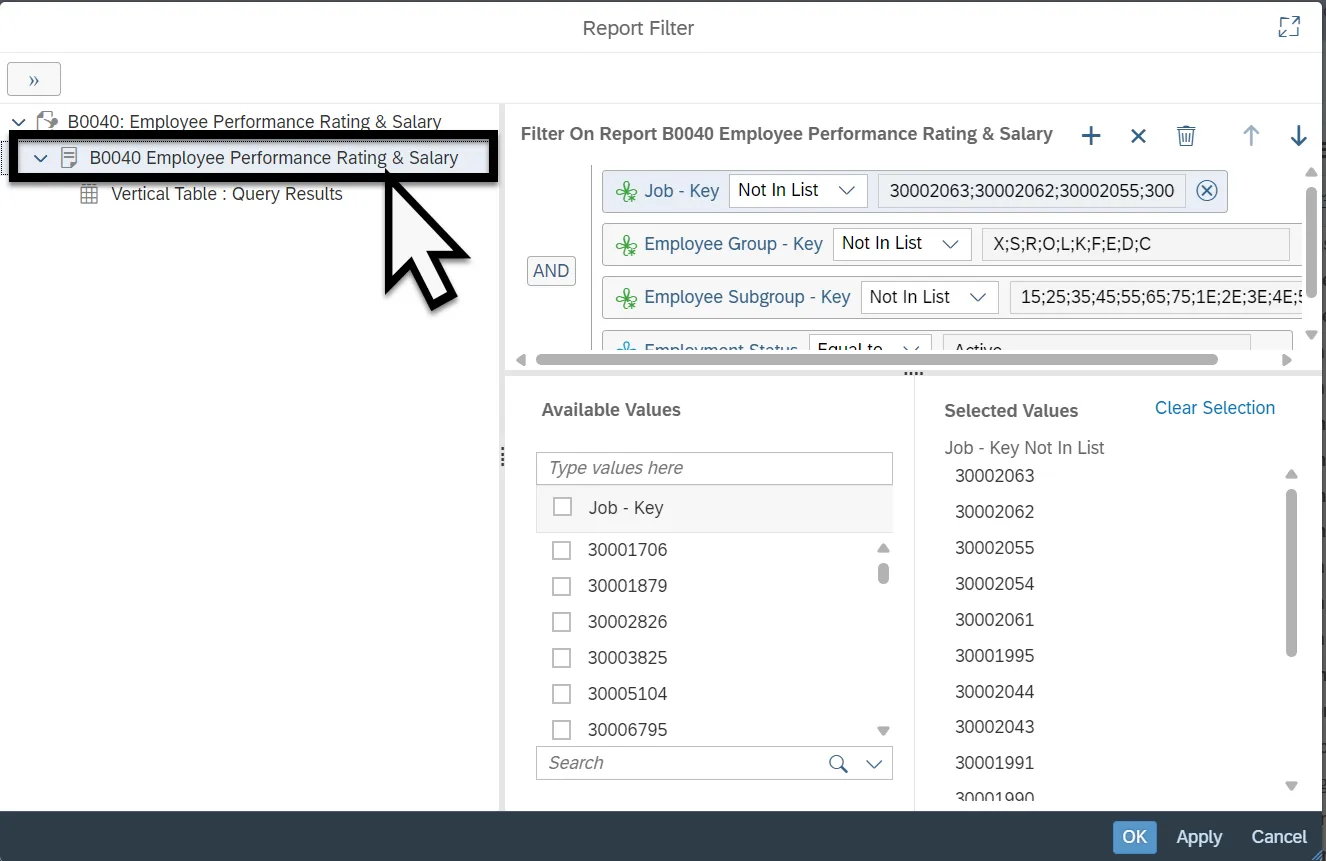
Step 6 - The report filter will display
- To include the jobs on the report:
Step 1 - Click the “Job – Key” filter to see the jobs that are excluded from the report
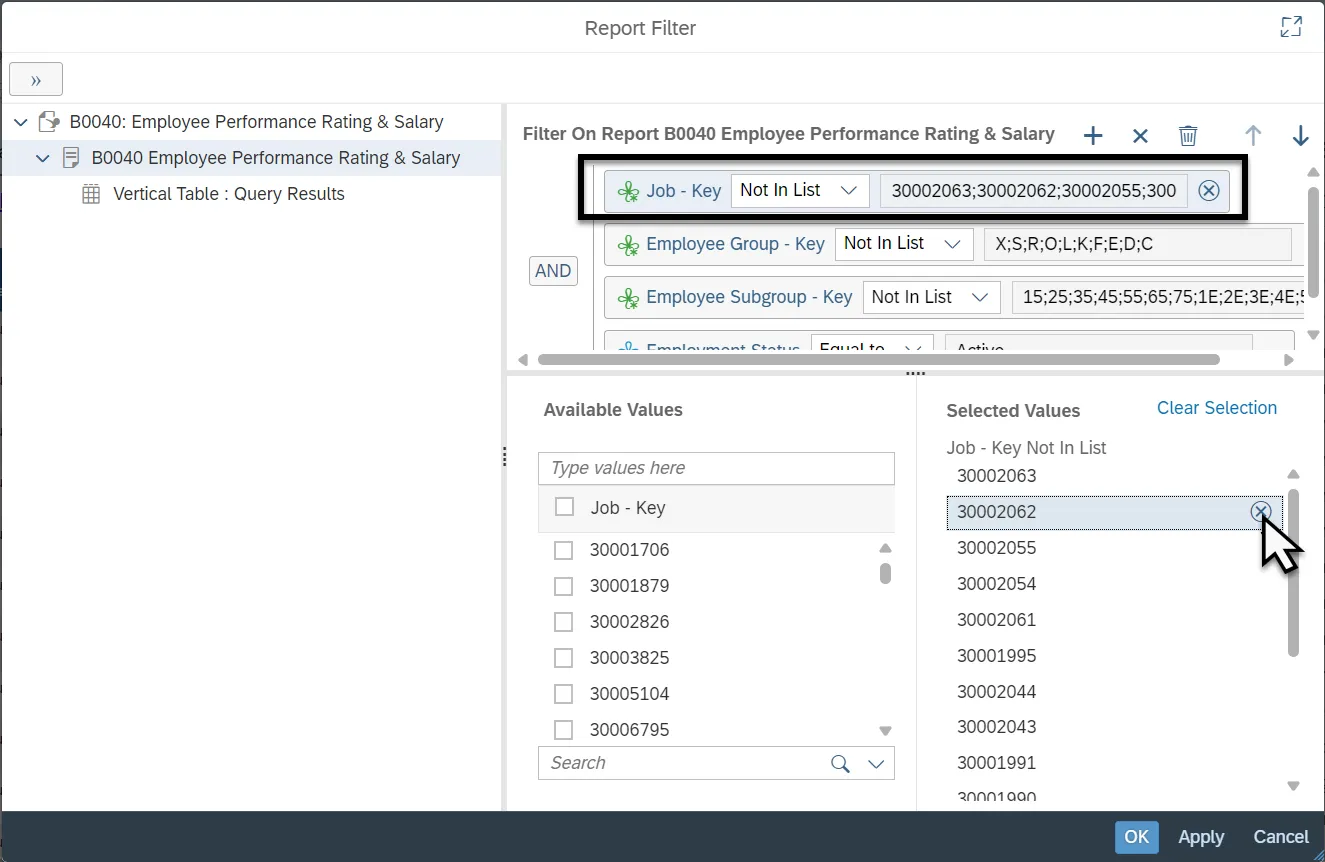
Step 2 - Select the job(s) you want to include on the report. In this example, the complete list is selected
Step 3 - Click the “x” to remove the job(s) from the exclusion list
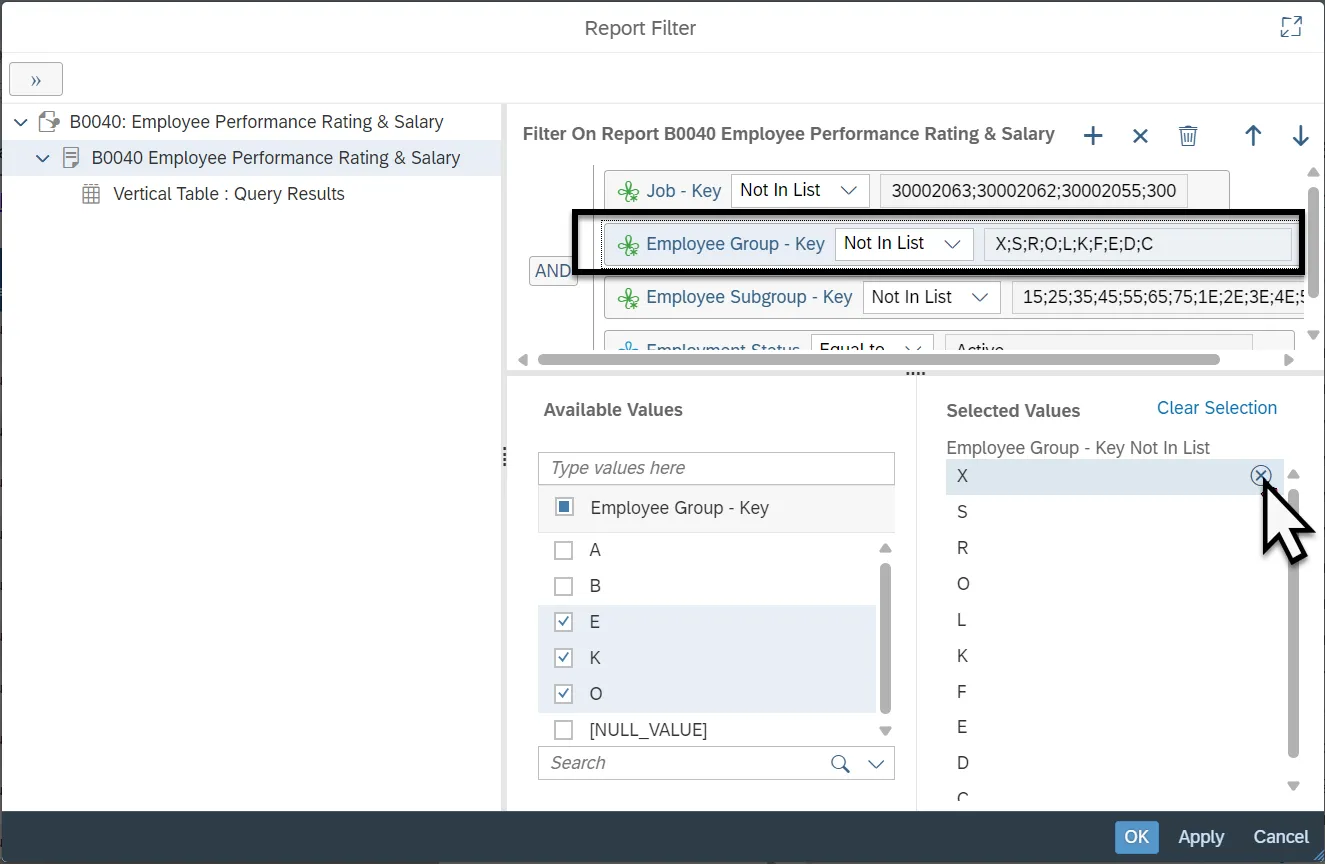
- To include the employee groups on the report:
Step 1 - Click the “Employee Group– Key” filter to see the jobs that are excluded from the report
Step 2 - Select the Employee Group(s) you want to include on the report. In this example, the complete list is selected
Step 3 - Click the “x” to remove the employee group(s) from the exclusion list
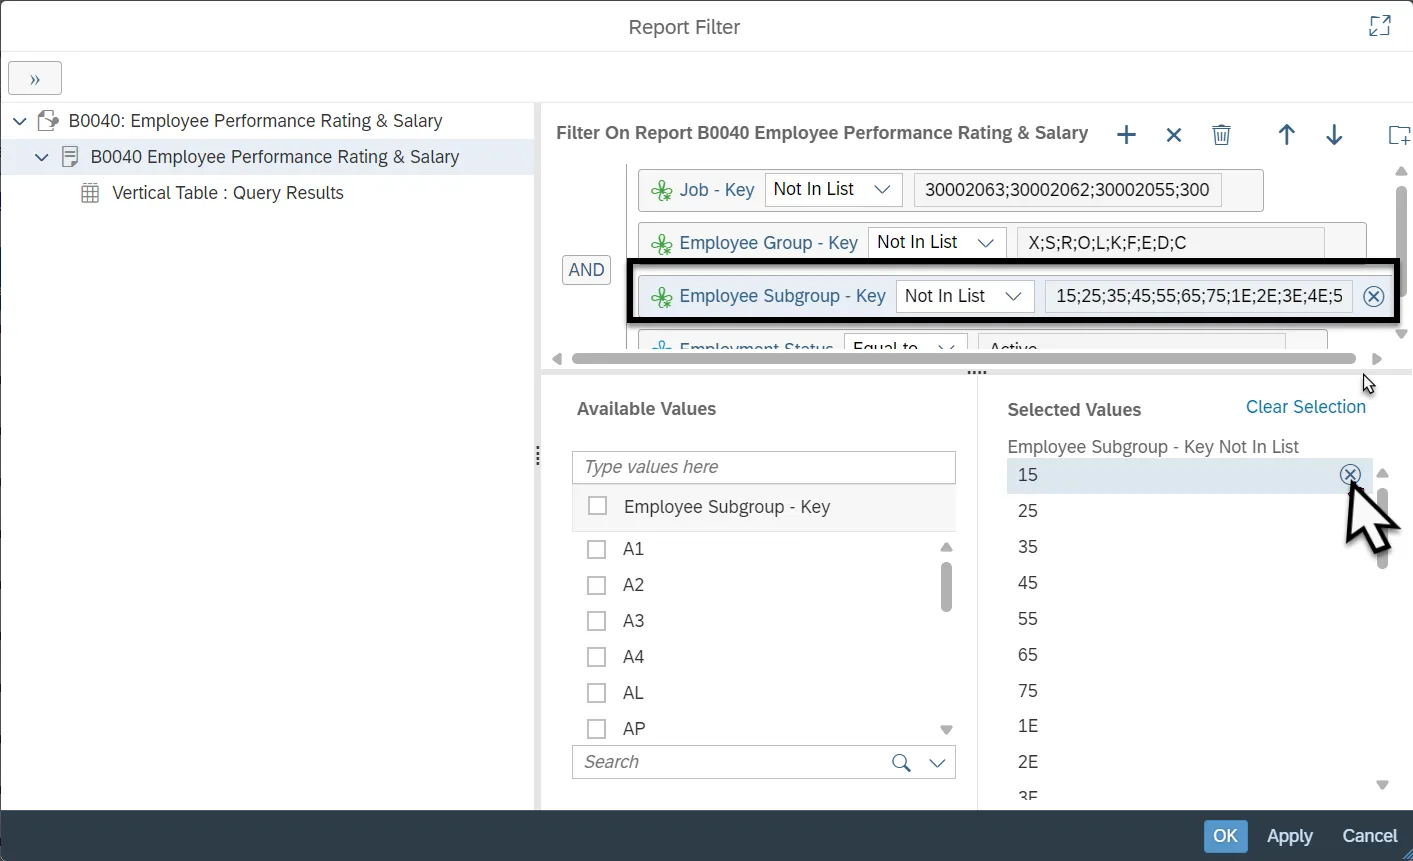
- To include the employee subgroups on the report:
Step 1 - Click the “Employee SubGroup– Key” filter to see the jobs that are excluded from the report
Step 2 - Select the Employee Group(s) you want to include on the report. In this example, the complete list is selected
Step 3 - Click the “x” to remove the employee subgroup(s) from the exclusion list