Purpose
The purpose of this Quick Reference Guide (QRG) is to provide a step-by-step explanation of how to apply a filter to an OTBI report in the North Carolina Financial System (NCFS).
Introduction and Overview
This QRG covers the process of applying a filter to an OTBI report.
Process
Please follow the steps below. There are 11 steps to complete this process.
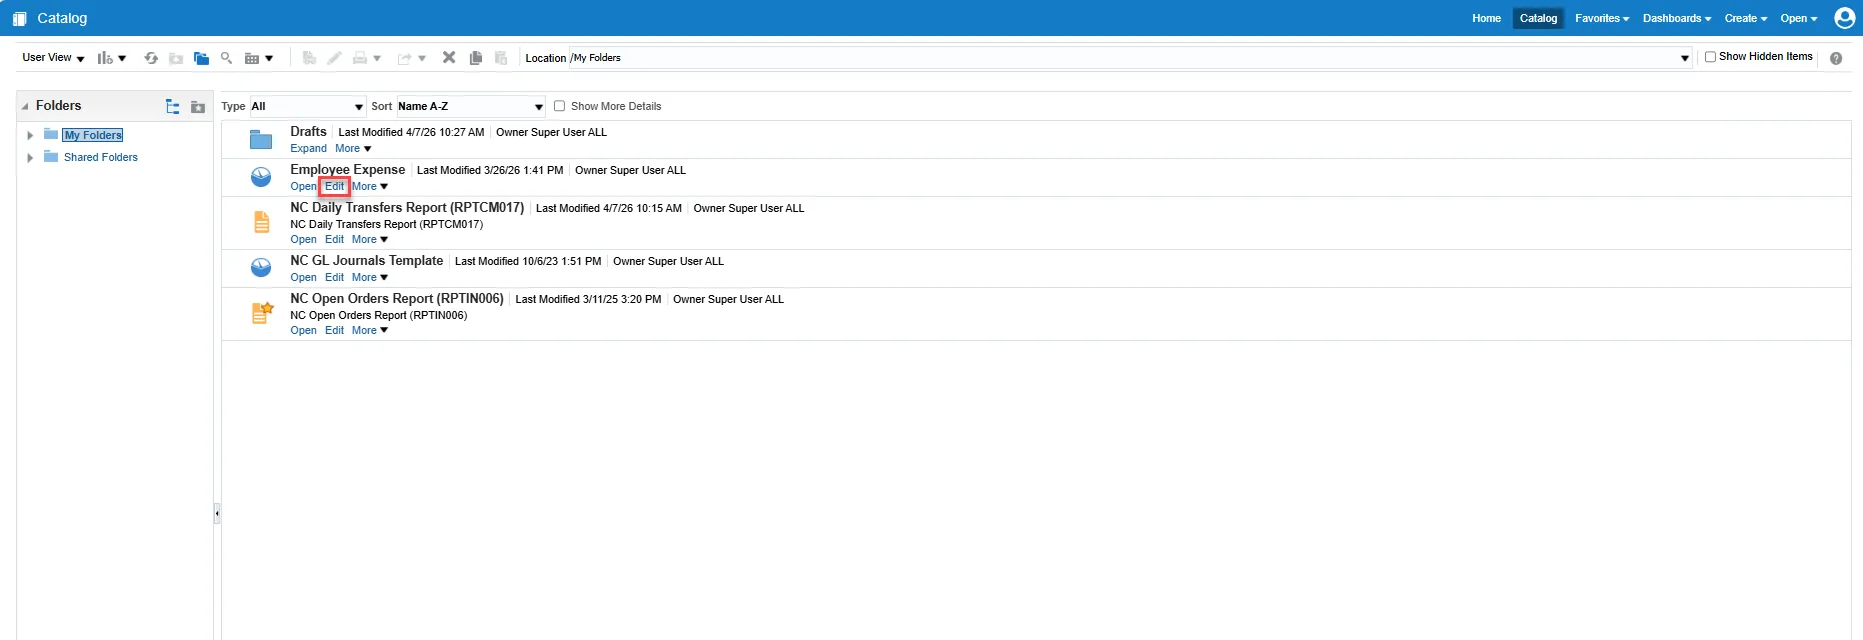
Step 1. Navigate to the Catalog page and choose Edit under a report.
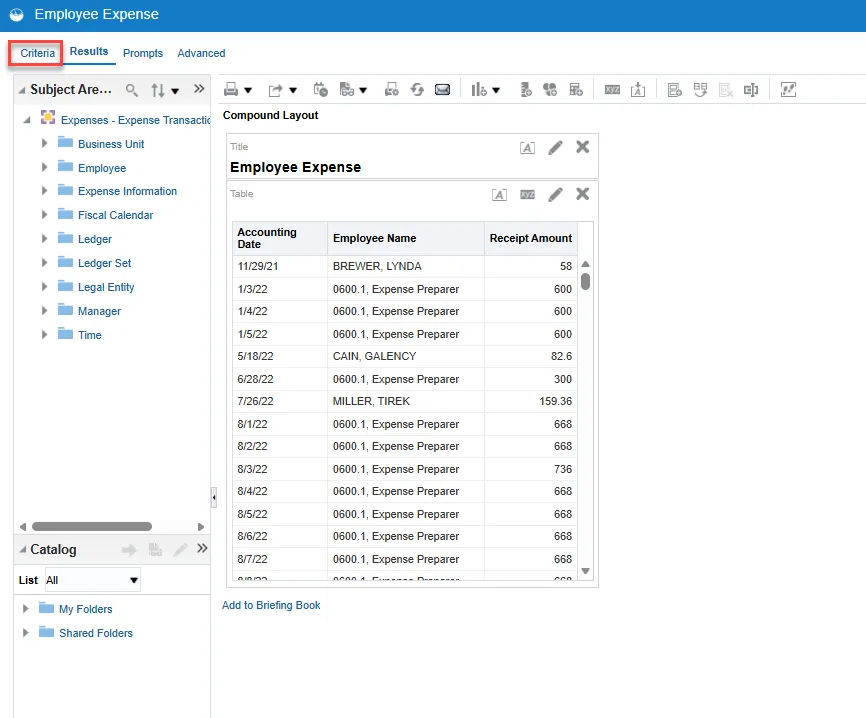
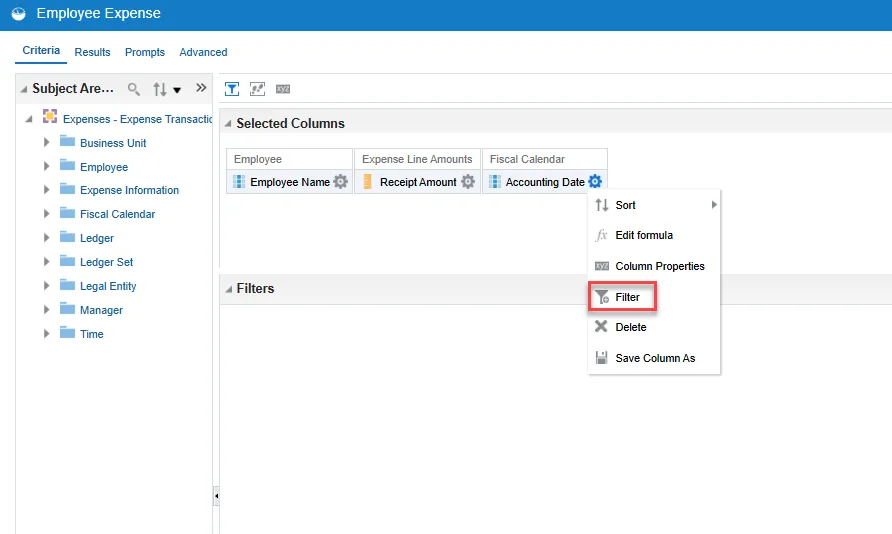
Step 2. Select the Criteria tab.
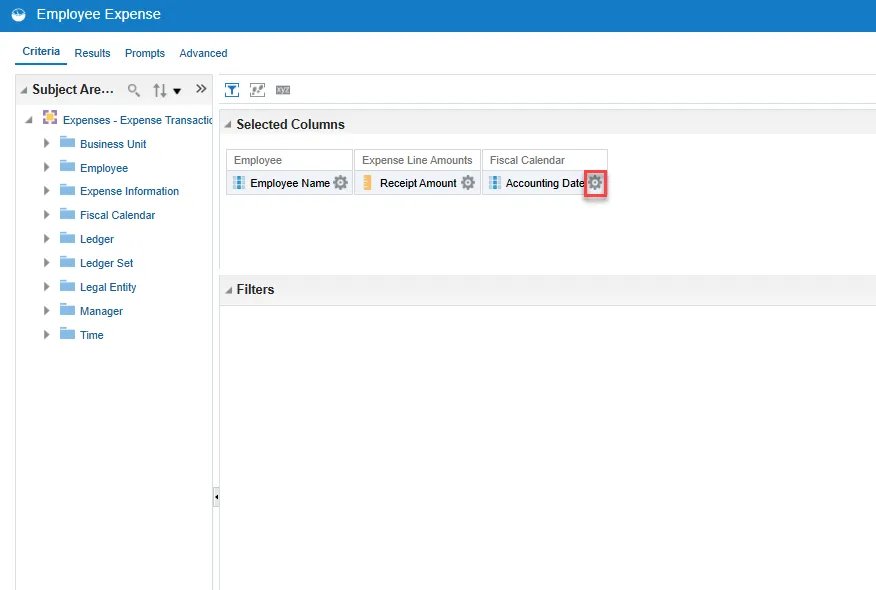
Step 3. Select the Gear icon in a column.
Step 4. Choose Filter from the drop-down menu.
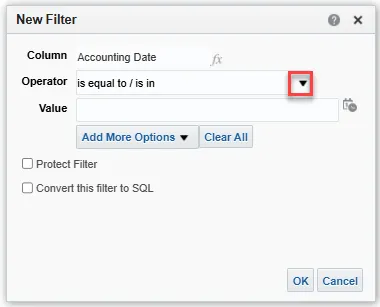
Step 5. The New Filter pop-up will default to “is equal to / is in” for the Operator field. Choose the drop-down arrow at the end of the field to change the Operator.
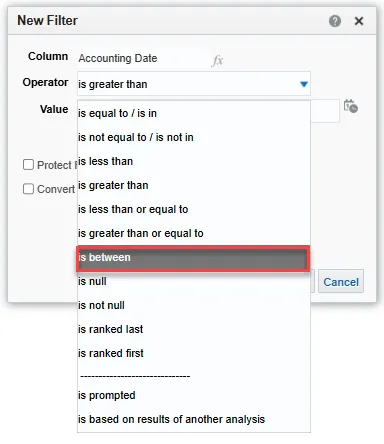
Step 6. Operator options will appear in the drop-down menu. In this example, is between will be chosen.
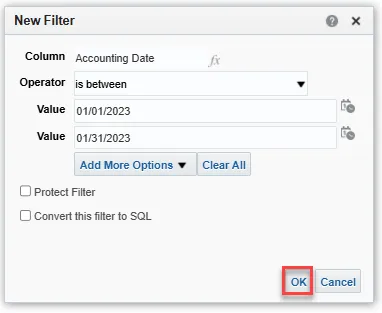
Step 7. In production, you would populate the Value fields to reflect a period of time. A longer period of time will take longer to populate data in the report. It is recommended to filter by as short a period of time as possible to expedite the analysis. In this example, the dates have been populated to represent one month of data.
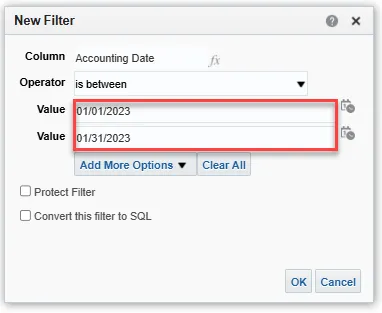
Step 8. Select OK.
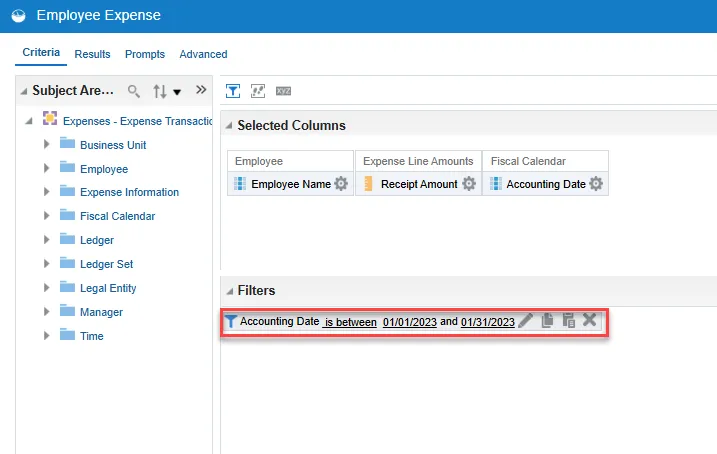
Step 9. The newly applied filter will populate in the Filters section. If you hover over it, you can choose Edit (pencil) or Delete (X). You can also proceed to add more filters if needed.
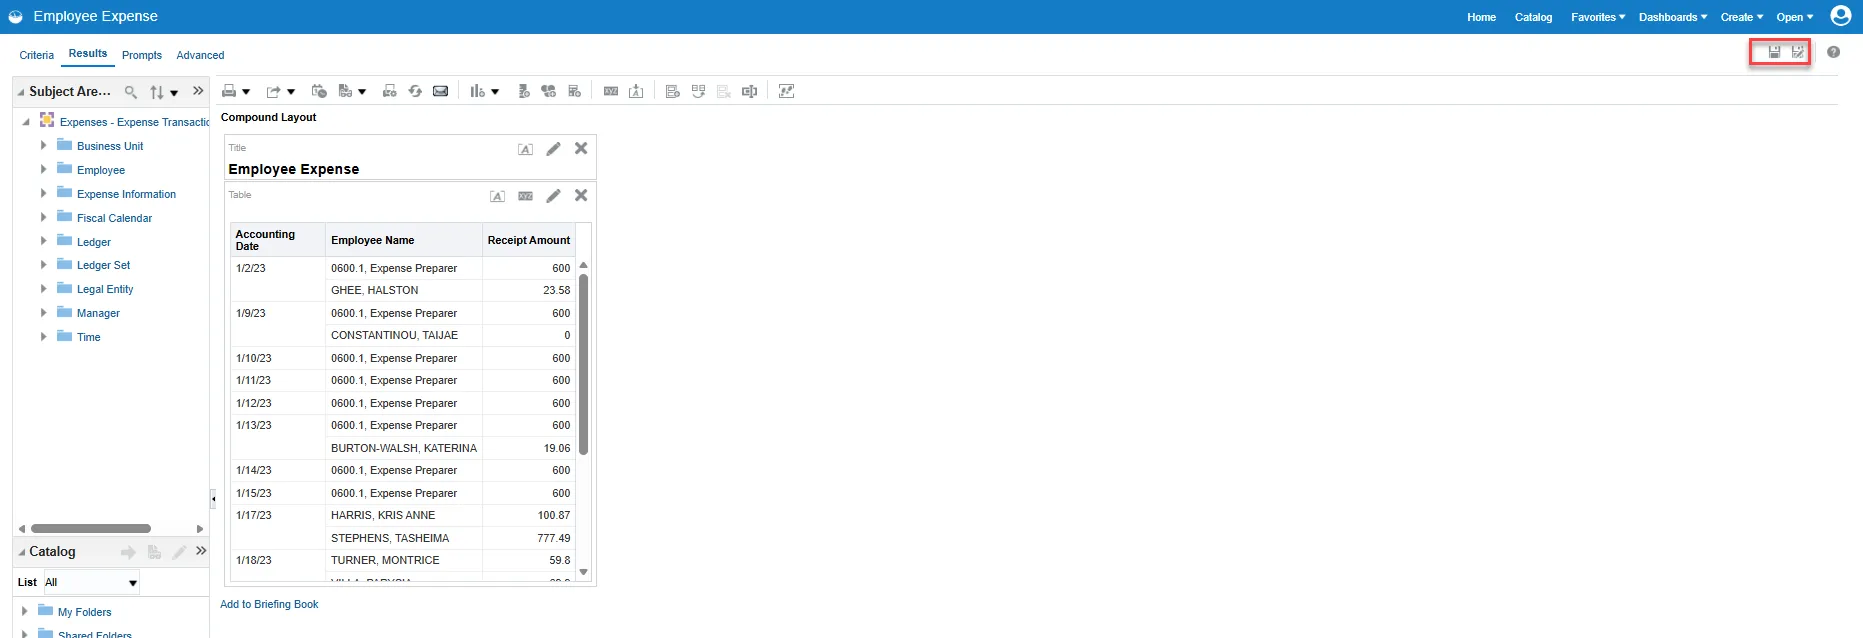
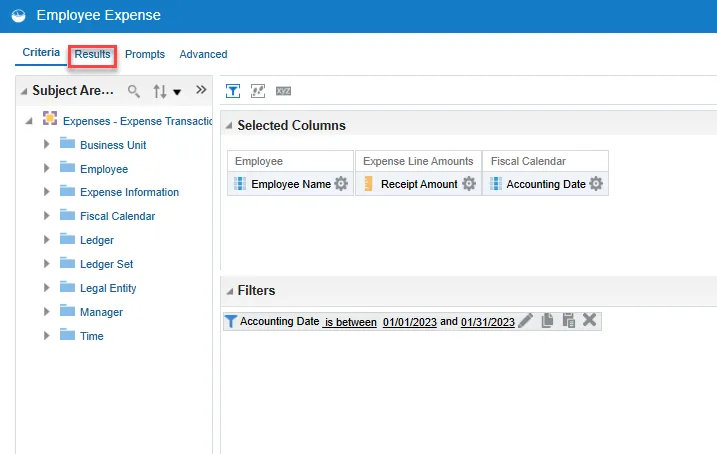
Step 10. Select the Results tab to generate the analysis.
Step 11. The report will populate the filtered data. Remember to use the Save or Save As button to save a copy of your data.