Purpose
The purpose of this Quick Reference Guide (QRG) is to provide current and historic data from the North Carolina Accounting System (NCAS) has been converted and stored into a SharePoint site using Power BI. Reports to access this data have been created, giving users the ability to search various fields.
Data Conversion
Data has been converted for the following products:
- General Ledger
- Balances
- Detail Posting Transactions
- DSS Summary
- Accounts Payable
- Active online Invoices
- Checks
- Invoice History
- Vendor
- Payment summary for last 5 years
- Fixed Assets
- Active and retired Inventory and Capital Assets
GENERAL LEDGER
Two categories of data have been converted for General Ledger, balances and posting transactions. The first BI report is called GL Balances. It contains the General Ledger period balances accounts (accounts beginning with 0 & 8). This information is similar to that found in the NCAS General Ledger module screen 16. Period balances, period activity and life to date balances have been converted for fiscal years 2004 – 2023. Periods 1 – 4 (July 2023 – October 2023) balances and activity for fiscal year 2024 have also been converted. For FY 24, the ending balance on NCAS (October, period 4) has been carried forward to all remaining periods. Complete GL balances for October, period 4 and all remaining periods are held in NCFS.
The second BI report, GL POSTING DETAIL, consists of every posting transaction for the fiscal year, excluding encumbrance and budget distributions. Posting transactions were created for fiscal years 2004 – 2024.
Data included in the GL Posting detail:
- Company, account, center
- Effective date, Transaction date
- Descriptions 1,2,3
- Subsystem
Based on the subsystem, additional fields have been created:
- AP – Paying entity, Vendor number/group, invoice number, invoice date, check number
- BC – BC Document ID
- IN – Item, Warehouse, Document ID
- AR – Customer, Document ID
Agencies should be able to retrieve data similar to that found on a NCAS DAPG67 report.
There is also a report called GL Balances – DSS. Fiscal years 2023 – 2004 have been created. This data is summarized by budget fund and assigned the correct GASB identifier. An ACFR structure has been applied to roll up the accounting distributions to a summary level, simulating the DSS ACFR reports. A detail discuss can be found towards the end of this documentation.
ACCOUNTS PAYABLE
There are two categories of data that have been converted for Accounts Payable -- invoices and checks. The first category of reports contains invoice data. Under AP Invoice Info, all invoices that currently reside on the Accounts Payable master files, that are available online, can be found. The data displayed includes:
- Paying entity, vendor number/group
- Invoice number, invoice date
- Payment amount, payment date, check number
- Remittance message
If you highlight an invoice on the report, additional details will include:
- Vendor name and address
- Each line of the invoice, accounting distributions, mini chart of accounts, line amount, item information, 1099 code, purchase order information
The report, AP Invoice History, contains the key information for each invoice entered in NCAS. This data goes back to the start of NCAS, for most agencies, 1995. Data displayed in this report includes:
- Paying entity, vendor number/group
- Invoice number, invoice date, vendor name (if found)
- Invoice status, payment date, gross amount
In addition to the invoice reports, there is a report that contains payment information. This data goes back to 2012. Data displayed in this report includes:
- Paying entity, vendor number/group, vendor name (if found)
- Payment type, payment amount, payment date, check number, BAP code
- Clearance date, clearance status
- Replacement check number
VENDOR INFORMATION
This report displays vendor remittance information. Data includes:
- Paying entity, vendor number/group, vendor name
- Payment totals for FY24 through FY20
- 1099 Payee name
- Remittance address
FIXED ASSETS
The fixed asset report displays active and retired fixed asset information. All active inventory and capital assets are included, along with 10 years of retired asset information. Data displayed in this report includes:
- Level1, Level2, Asset number, standard desc code, asset description
- Level3 – Level14(object)
- Acquisition date, indicator, real/personal, new/used, ownership,
- Asset cost, annual depreciation, Life to date depreciation, estimated life
- Location
- Model, Manufacturer, serial number
- PO Number, check number, fund, cost center
How to use BI Reports
To access the reports, you must be authorized. Please contact your Security Administrator to obtain access.
To access the SharePoint site, enter: https://app.powerbigov.us/Redirect?action=OpenApp&appId=d01b0e1d-1511-4b57-98c2-468425982dc7&ctid=a1f43f48-54fe-433f-9378-968b45bc6665
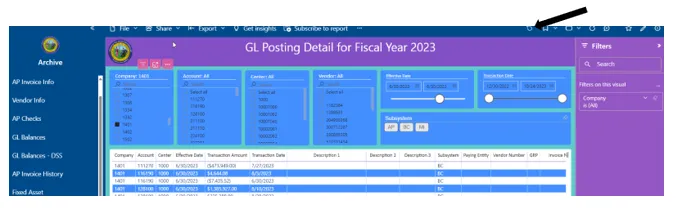
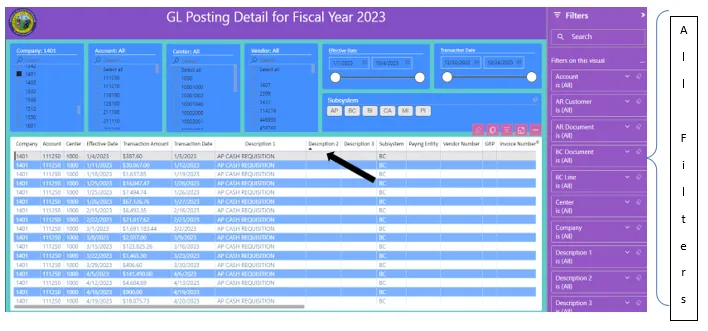
The different reports are displayed in the left column. For our example, we will use the GL Posting Detail report.
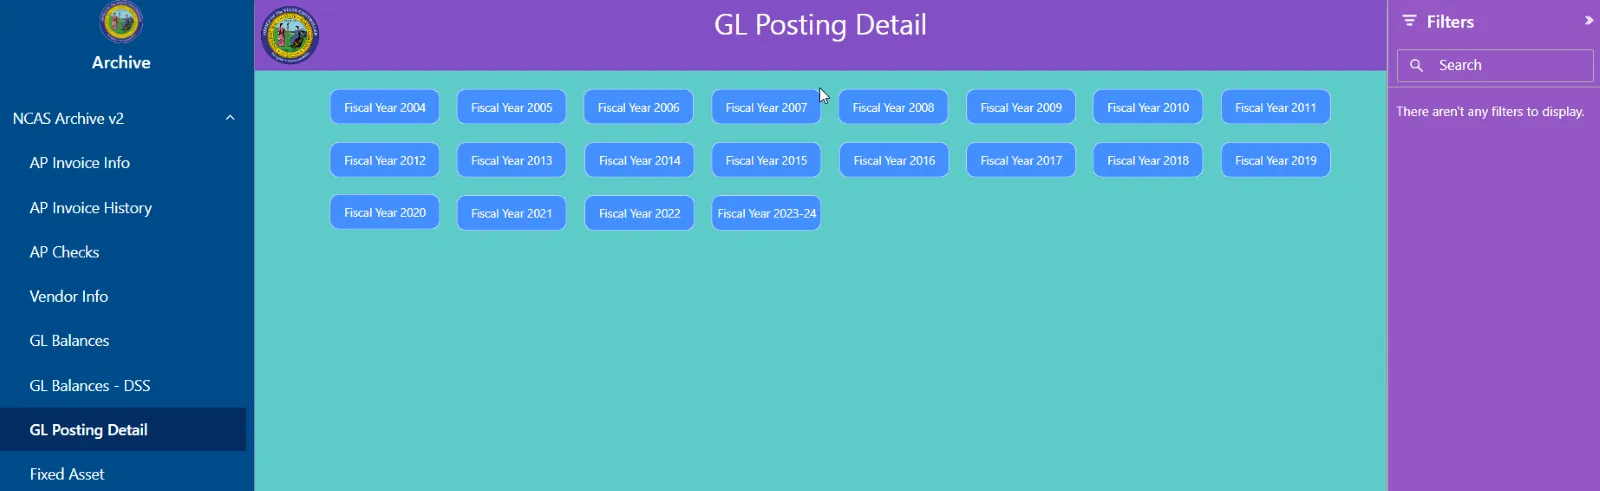
Once you select the report, select the fiscal year you want to view. BI will gather the data for that fiscal year and display the report. First, you will want to select the GL company(s) you would like to display:
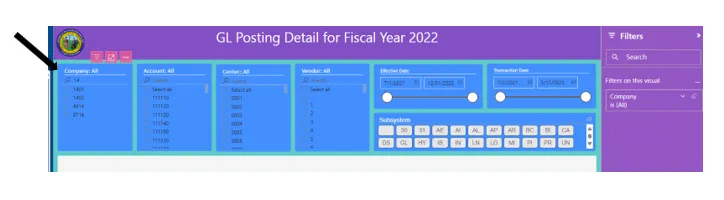
You can use the search function above the list of companies. If you want to select more than one company, hold the control key between selections. You can also use the filters or slicers on the right side of the screen. To activate the filters, click on one of the columns (company, account, center, vendor).
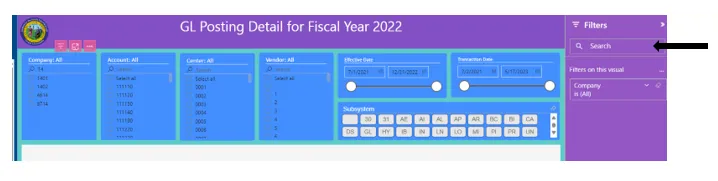
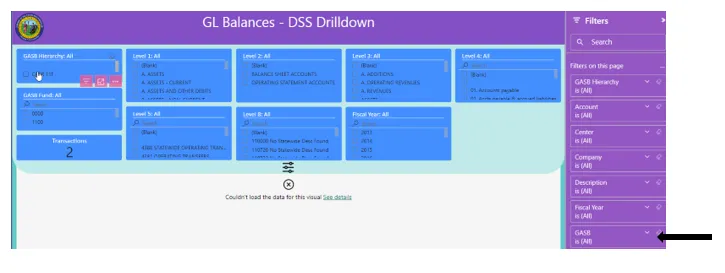
Click on the down arrow to reveal the filter options. You have basic filter where you select the individual items, or you have advanced filtering:
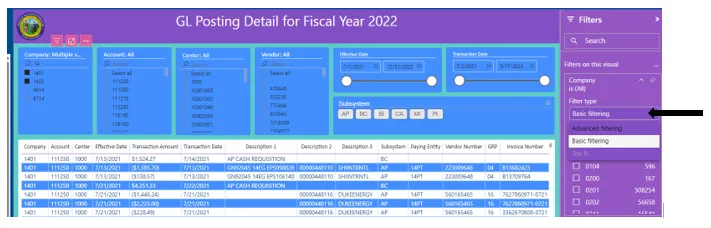
If you select advanced filtering, you reveal additional options:
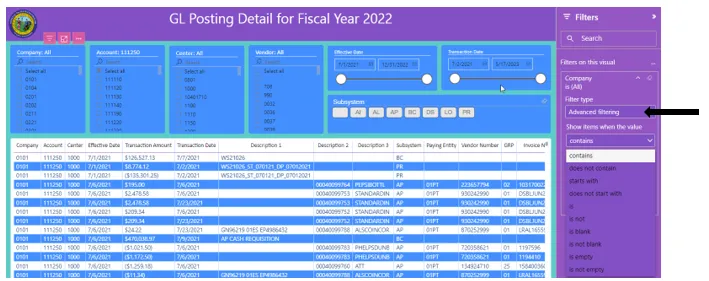
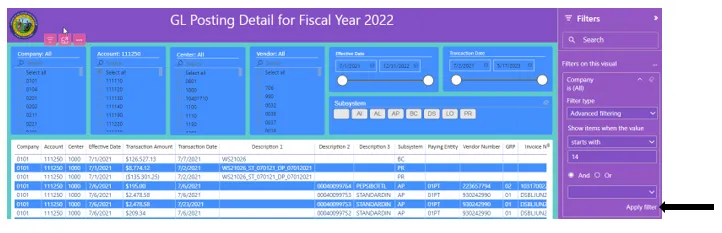
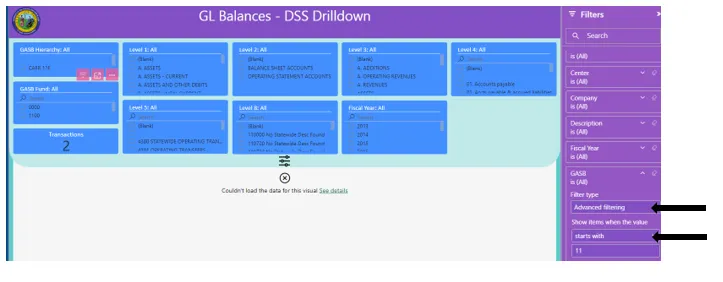
Here, instead of selecting the individual companies, you could use “starts with”, enter your agency and the report would select all your agencies companies. MAKE SURE YOU CLICK APPLY FILTER to invoke the selection:
To reset ALL filters, click the icon shown at the top of the page on the right.
Some reports keep the filters at the top of the page, like below:
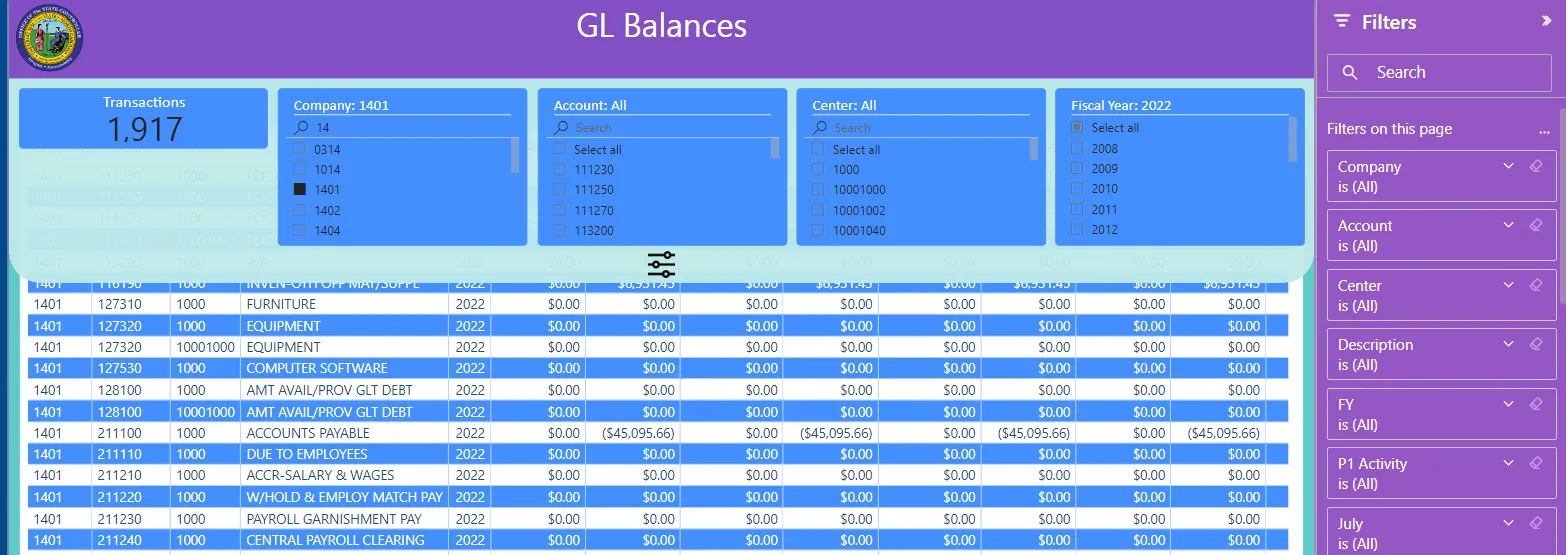
To see all the data, click on the hide slicer button in the center of the page. You can toggle back and forth between the detail and the filters by clicking the filter (slicer) icon.
You can use filters or slicers for any of the fields in the report. To access all the fields for search capabilities, click in any of the report columns.
If you would like to export your selected transactions to EXCEL, move your cursor to the top of the report headers. Four boxes appear. The last box contains three periods – “more options”.
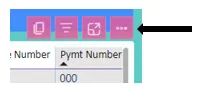
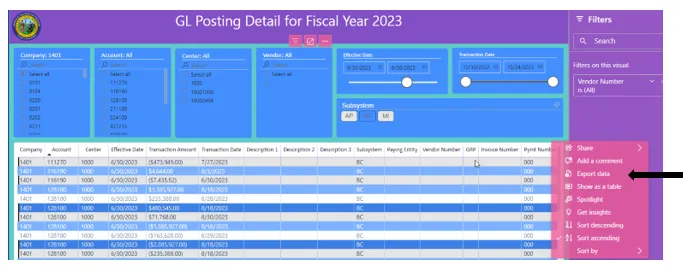
Once you click export, an export screen will appear.
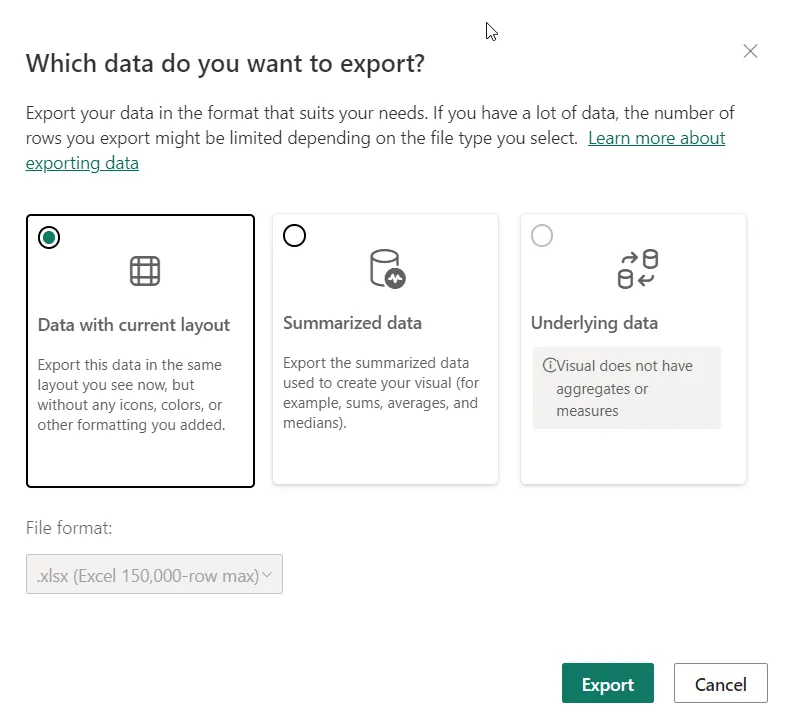
Select data with current layout and click export. The data will be loaded into your download folder. Once you open it, you can rename and save in excel format.
If you are unsure exactly which filters are being applied to your data, you can click on the filter icon at the top right-hand corner.
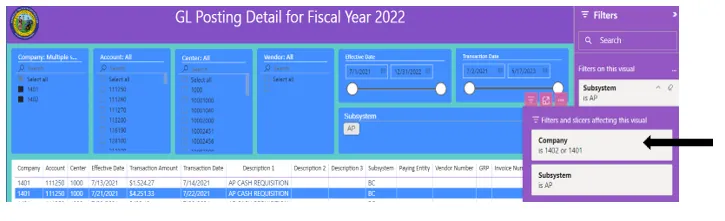
A box will display containing the filters affecting this report view.
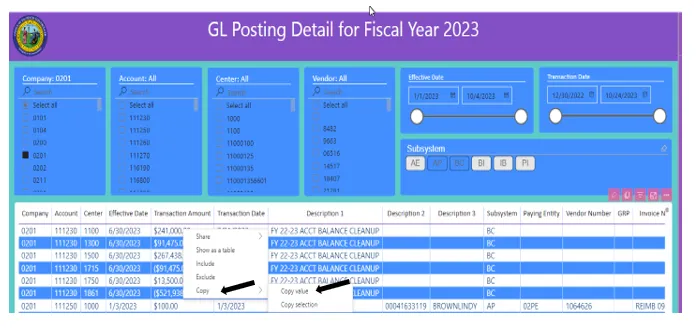
If you would like to copy a value, RIGHT click over the value to copy. An additional box will display. Select COPY and two choices will appear, copy value or copy selection. Copy Value will copy the cell that is highlighted. Copy selection will copy the entire row(s) that is highlighted, along with column headings.
GL BALANCES – DSS
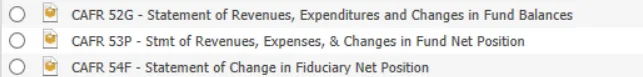
The General Ledger Balances – DSS report has been created to simulate CAFR reports from DSS. A structure has been used to roll up values to summary lines that match values from reports. The following reports can be simulated using GL Balances – DSS:
NOTE: One major difference with the BI structure and DSS reports. All numbers display as positive, unless they are inherently negative. To NET Assets and Liabilities, you would have to do that calculation offline, since both totals are positive.
First, select a structure. The structures are found under GASB Hierarchy:
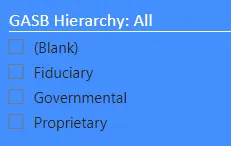
The Governmental structure is used to generate the CAFR11G Balance Sheet and CAFR52G Revenues and Expenditures reports. The structure is used for the following GASBs:
- General Funds (11xx)
- Special Funds (12xx, 13xx)
- Capital Funds (14xx)
- Permanent (15xx)
- Fixed Assets (5100)
- General Long-Term Debt (5200)
The Proprietary structure is used to generate the CAFR11P Net Position and the CAFR53P Statement of Revenue and Expense. The structure is used for the following GASBs:
- Enterprise (25xx)
- Internal Service (27xx)
- Component Units (26xx)
- Other
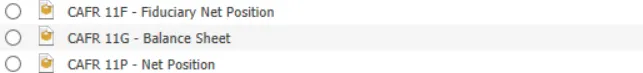
The Fiduciary structure is used to generate the CAFR11F Fiduciary Net Position and the CSFR54F Change of Fiduciary Net Position. The structure is used for the following GASBs:
- Pension and other Employee Benefit Trust (33xx)
- Investment Trust (34xx) (for some years)
- Private Purpose Trust (35xx)
- Custodial (39xx)
Next, select the fiscal year. If no fiscal year is selected, all fiscal years will be summarized.
Then, select the GASB range you want to view. For example, if you wanted to look at General Fund, you would select all 11xx GASB.
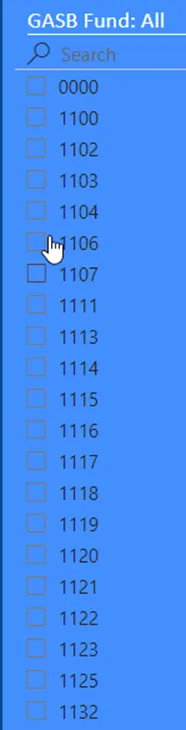
You could tag each of the 11XX GASB values or use the advance filter on the right.
NOTE: There are accounts that are not used in this structure. They would fall under All Accounts of Grant Budget.
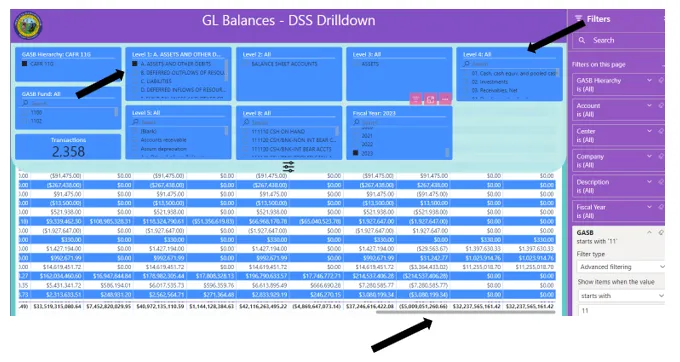
In this example, Advanced Filtering is selected, along with the STARTS WITH option, value being 11:
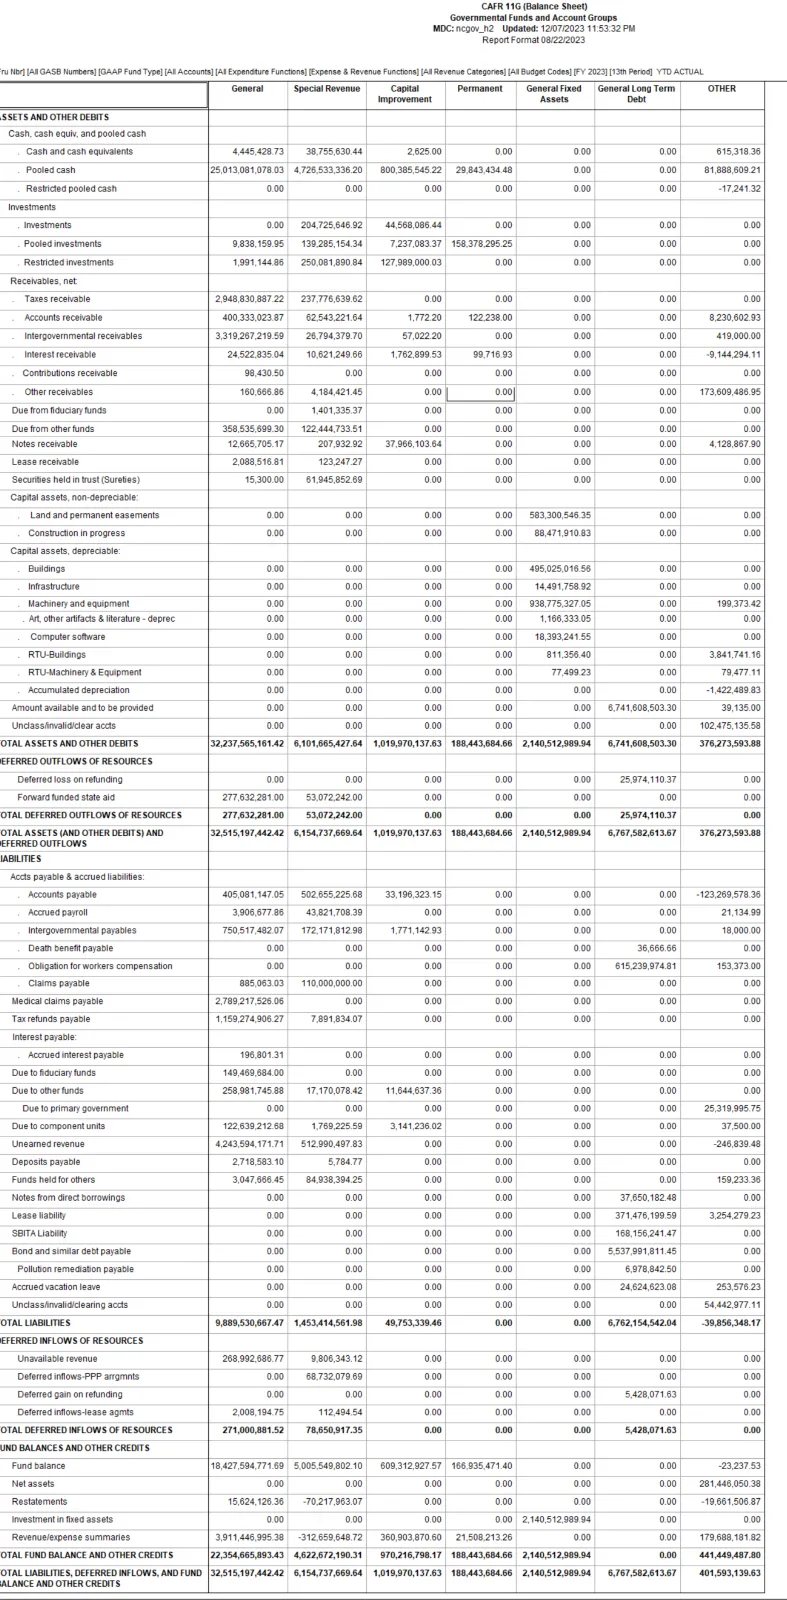
Below is the CAFR 11G for YTD values, period 13. Level 1 of the structure is the high level DSS rollups.
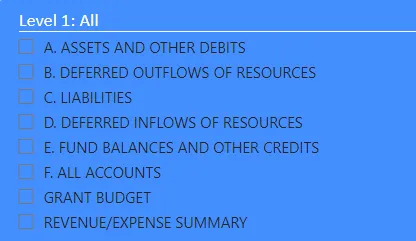
Level 4 corresponds to the second level line items in the category:
Since Level 1 was selected in the example above, a total for all Assets and other Debits appears in the bold total line at the bottom of the page.
If you want to dig deeper into individual summary lines, use Level 4 to select the line category. If you want to dig deeper still, by company or account, use the filters on the right side for your desired selection. Alternately, you can use Level 8 to select the accounts. Some accounts (like the AA accounts) have been aggregated into a “high level” account, like 5369XX. To select individual accounts, use the filter for Account on the right side of the table.
To display the Revenue and Expenditure reports, select REVENUE/EXPENDITURE from Level 1. Then Level 3 will have the breakdown of revenues and expenditure categories, with Level 4 being a line-item breakdown.
One difference between the actual DSS reports and the BI reports is that BI cannot do calculations. DSS has summary lines that net Assets and Liabilities or Revenues and Expenditures together. Because the lines were to be displayed as positive numbers, netting was not possible. The totals for each category are correct, user would have to do any additional netting calculations offline.